USDA Hardiness Zone Changes 101
If you woke up on November 15, 2023, feeling like the world was different, you were right. On that day, the U.S. Department of Agriculture updated its Plant Hardiness Zone Map for the first time since 2012.
While this likely won’t result in any radical alterations to your gardening strategy, understanding why these changes occurred can help ensure a healthy garden for next year and beyond!
What are the USDA Plant Hardiness Zones?
Let’s first take a step back to better understand what the USDA Plant Hardiness Zones are.
The USDA produced its first modern hardiness zone map in 1960. The specific goal was to help gardeners and landscapers know which plants were likely to thrive where they lived.
If we wanted to give the maps a much more specific name, we’d likely call them the Average Annual Extreme Minimum Temperature Maps. That’s a lot of words smashed together to ultimately say that the map shows the average lowest temperature for a location over a specific time.
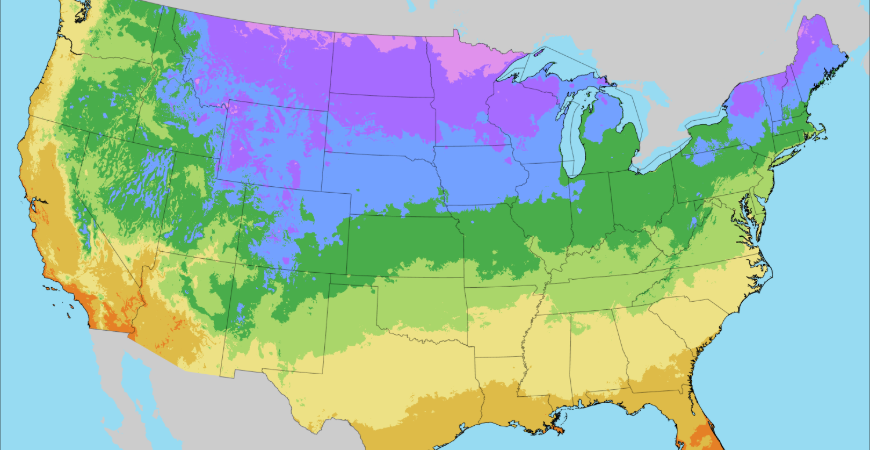
When you look at both the previous map and the new one, you’ll notice wide bands of color. These colors represent areas whose average lowest temperatures are within five degrees of each other.
So, for instance, Hardiness Zone 7A’s average lowest temperature ranges from 0 to 5 degrees Fahrenheit. The next zone, 7B, falls into the next range of 5 to 10 degrees Fahrenheit.
(We should note that the maps don’t show the coldest it has ever been or will ever be in a specific location. There’s a lot of year-to-year variation in those numbers, making them harder to map and less useful to use.)
Certain plants can’t survive below certain temperatures. Because the map shows you how cold it will likely be in your region, it becomes easier to determine what plants or flowers will thrive there.
Why Did the USDA Hardiness Zone Map Change?
The 2023 update wasn’t a massive overhaul of the entire map. Many things remain the same.
You’ll still see the map has 13 hardiness zones. Additionally, each zone remains split between an “A” and “B” half-zone, with each half-zone representing a five-degree range in the average lowest temperature.
In fact, the definition of each zone hasn’t changed at all: Zone 7a in the 2012 map and Zone 7a in the 2023 map still represent areas where the average lowest temperature is between 0 and 5 degrees Fahrenheit.
What has changed is the locations and boundaries of those zones.
The country has grown warmer over the past 30 years. Because of that, many locations in the 2023 map are now in the next hottest half-zone.
With this increasingly warmer weather, some boundaries between the zones have changed, too. There are two main drivers behind these boundary updates:
- The 2023 map uses more recent temperature information. (The average low-temperature data is from 1991 to 2020.)
- The 2023 map incorporates data from more weather stations. (Data from 13,412 weather stations helped create the 2023 map, while the 2012 map used 7,983.)
A benefit of using more weather stations is that the 2023 map is far more detailed, especially in regions that tend to be more rural. With the online version of the map, you can even add different layers of geographical info, such as county borders and road names.
So, while this new map doesn’t represent a dramatic change, it does offer more accuracy and details than the previous version. For a more in-depth and algorithm-oriented explanation of the changes between these two maps, the USDA’s website offers an explainer.
What USDA Hardiness Zones Am I In?
We’ve interspersed the link a couple of times already, but the best way to see what USDA Hardiness Zone you’re in is to check the map.
At the very top of the map, you’ll see an empty search box with “Zip Code Zone Search” written beside it. Simply type in your zip code, and you’ll be presented with your specific hardiness zone.
If you’re a more visual learner, you can use the interactive map below that search box and zoom in on your location. For Alaska, Hawaii, or Puerto Rico residents, you can use the separated boxes beneath the contiguous U.S. map.
You can also download the maps for offline use here.
With previous maps, there was some concern about the accuracy of the hardiness zone boundary as you progressed from the east coast of the country to the west. Elevation changes and the general unpredictability of the Pacific Ocean were the main contributors to this inaccuracy.
The new maps reduce the inaccuracy by using data from more weather stations spread across a wider range of elevations. So, those previous concerns should be minimized when viewing the latest map.
Finally, there is little doubt that the world is undergoing climate change. As we get further and further from the date the USDA created this map, the more likely it is that zones and boundaries will require further updating.
So, if you come across this post in 2044, do a quick search to ensure you’re viewing the latest map.
Can You Still Use Old USDA Hardiness Zone Maps?
Over 80 million gardeners in the United States rely on hardiness zones for their gardening. So, the map must be accurate and usable across the country.
It bears repeating because it can be a confusing point to come across: the plant hardiness zones themselves have not changed. What’s changed is the location of those zones.
So, if you find a plant that thrives in Zone 11, such as the black bat flower, it will continue to thrive in Zone 11. The only difference is more locations are now considered Zone 11 and thus an apt spot for this exotic flower.
This is an important thing to note because, as of this writing, the new USDA Plant Hardiness map is only about six weeks old. That means most of the internet is populated by a variety of older guides, including our 2014 guide, that may contain inaccurate info.
And in some cases, the difference in accuracy may be slight. A plant that thrives in 7A is likely to survive in 7B, for instance.
Of course, newer guides will soon start popping up and pushing their way to the top of your search results. In the meantime, though, it’s important to view old guides through the lens of the hardiness zone instead of the geographical info.
What Plants Grow Best in Which USDA Hardiness Zone?
With that in mind, here are some of our favorite plants to grow in various USDA Hardiness Zones. We’ve grouped them by overall region, but make sure to check the 2023 map first before planting.
For much of Alaska, the very northern tips of the central and eastern U.S., and some of the highest elevations of the Rocky Mountains, we recommend:
- Zone 1: Crowberry, dwarf birch, and Pennsylvania cinquefoil
- Zone 2: American cranberry bush, eastern larch, and paper birch
- Zone 3: Foxglove, goldenrod, and juniper
For the northern Midwest, parts of the Rocky Mountains, and much of the northeast, we recommend:
- Zone 4: Crabapple trees, panical hydrangeas, and sugar maples
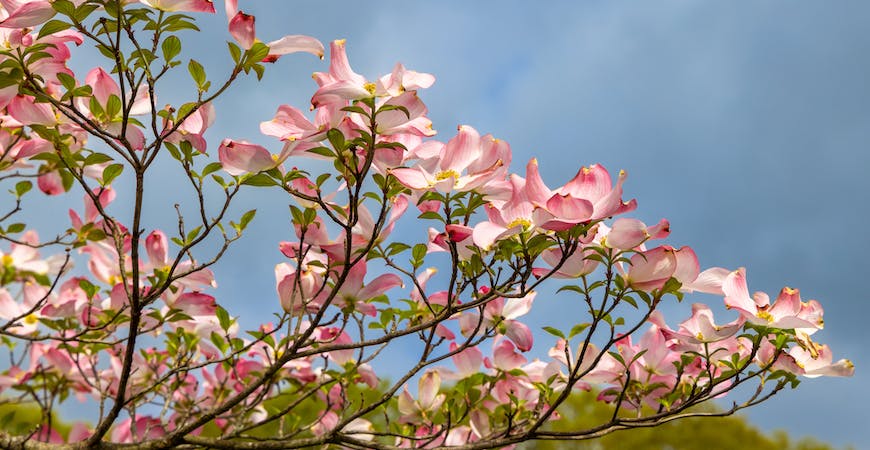
- Zone 5: Boston ivy, delphiniums, and flowering dogwood
For the region that stretches from northeastern Washington and northwestern Montana down through northern New Mexico and back up through the midwest to New Jersey and Connecticut, we recommend:
- Zone 6: American holly, common boxwood, and weeping willows
- Zone 7:Bigleaf maple, kurume azalea, and magnolia trees
For much of the Pacific coast, through Texas, and back up to North Carolina, we recommend:
For the southern portions of California, Arizona, Texas, and Louisiana, as well as much of Florida and Hawaii, we recommend:
- Zone 10: Eucalyptus, palmetto palm trees, and rubber plants
- Zone 11: Avocado trees, citrus trees, and lemongrass
For Hawaii and Puerto Rico, we recommend:
- Zone 12: Birds of paradise, hibiscus, and orchids
- Zone 13: Bamboo, banana trees, and palm trees
Use the USDA Plant Hardiness Zone Map for a Thriving Garden
While the change may be subtle, the updated hardiness zone map is the most accurate to grow a thriving garden. So, bookmark the updated map as the first step for a healthy, luscious garden.

